There are two tabs in a quiz created using Google Forms, “questions” and “responses”. The “Responses” tab allows us to stop accepting responses if we decide to do so. It also offers us three approaches to response analysis: summary, question and individual.
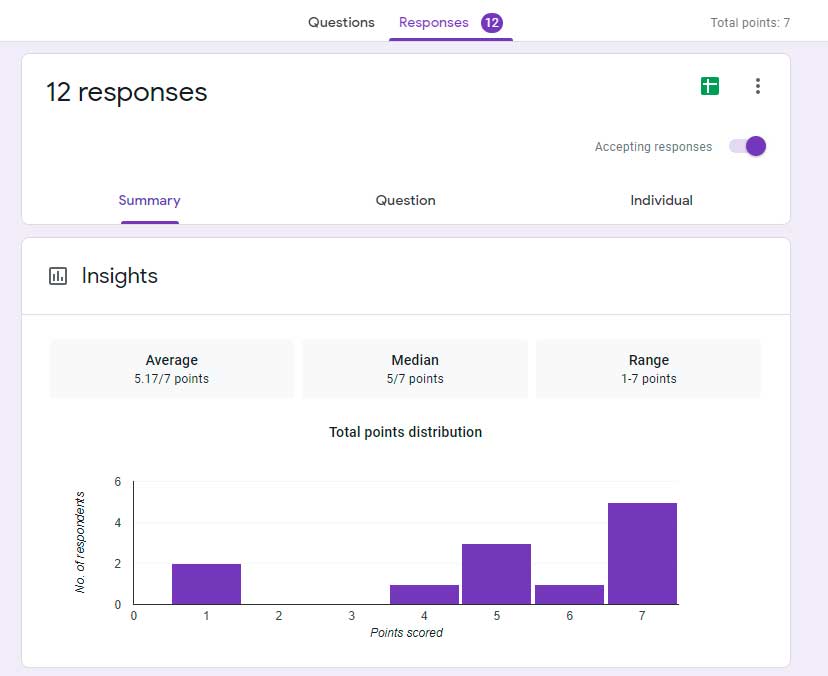
The screenshot above shows the “Summary” tab, which gives teachers a useful overview of the group’s performance in the quiz. First of all, we see a bar chart with information about the total score. The average and median value is automatically calculated. The example above, we can see that most students got 70% of answers right or more. There’s one student who clearly needs help.
The bar charts below the summary display each question’s performance. Teachers can see how many students clicked on the right answer and how many clicked on distractors.
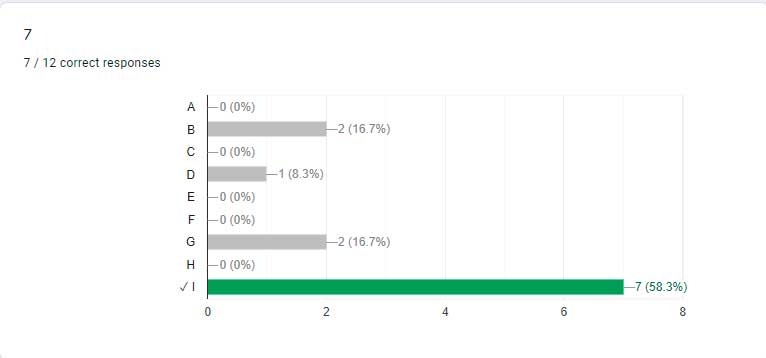
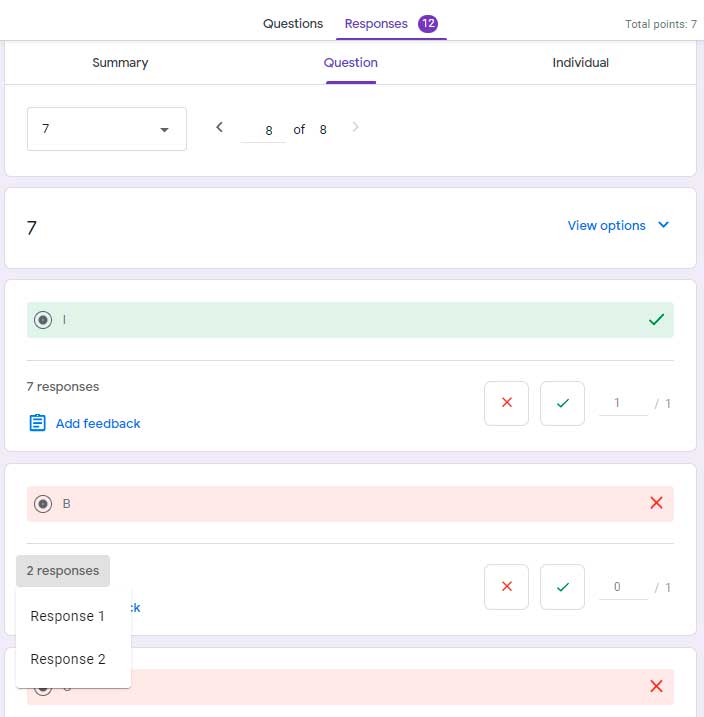
These charts allow teachers to spot difficult questions and give appropriate feedback to students. However, there’s another tab devoted to the analysis of individual questions. This tab, called “Questions” allows teachers to see which respondents clicked on each option.
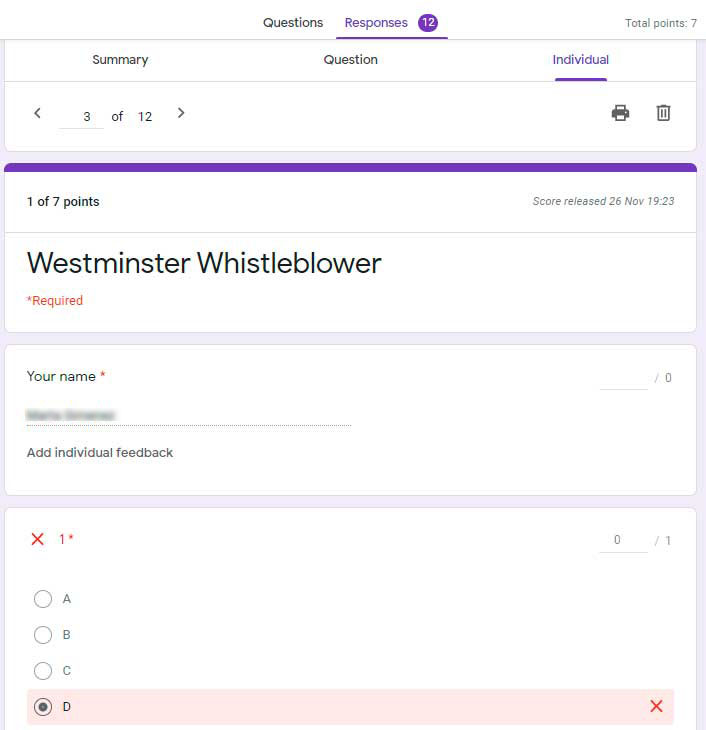
Finally, we have the “Individual” tab, which displays each response. This may be useful for one-to-one tutorials if we have included a “name” or “e-mail field” in the questionnaire.
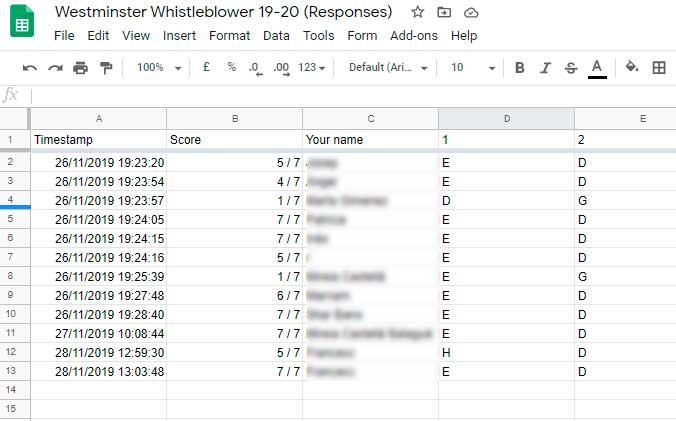
Apart from the charts, we can obtain a spreadsheet with each respondent’s total score by clicking on the green icon on the top left corner of the Gform.
For more information about individual feedback, read this post.